
Latest Version
The Graphs Developers
Education
Linux
Free
se.sjoerd.Graphs
Report a Problem
More About Graphs
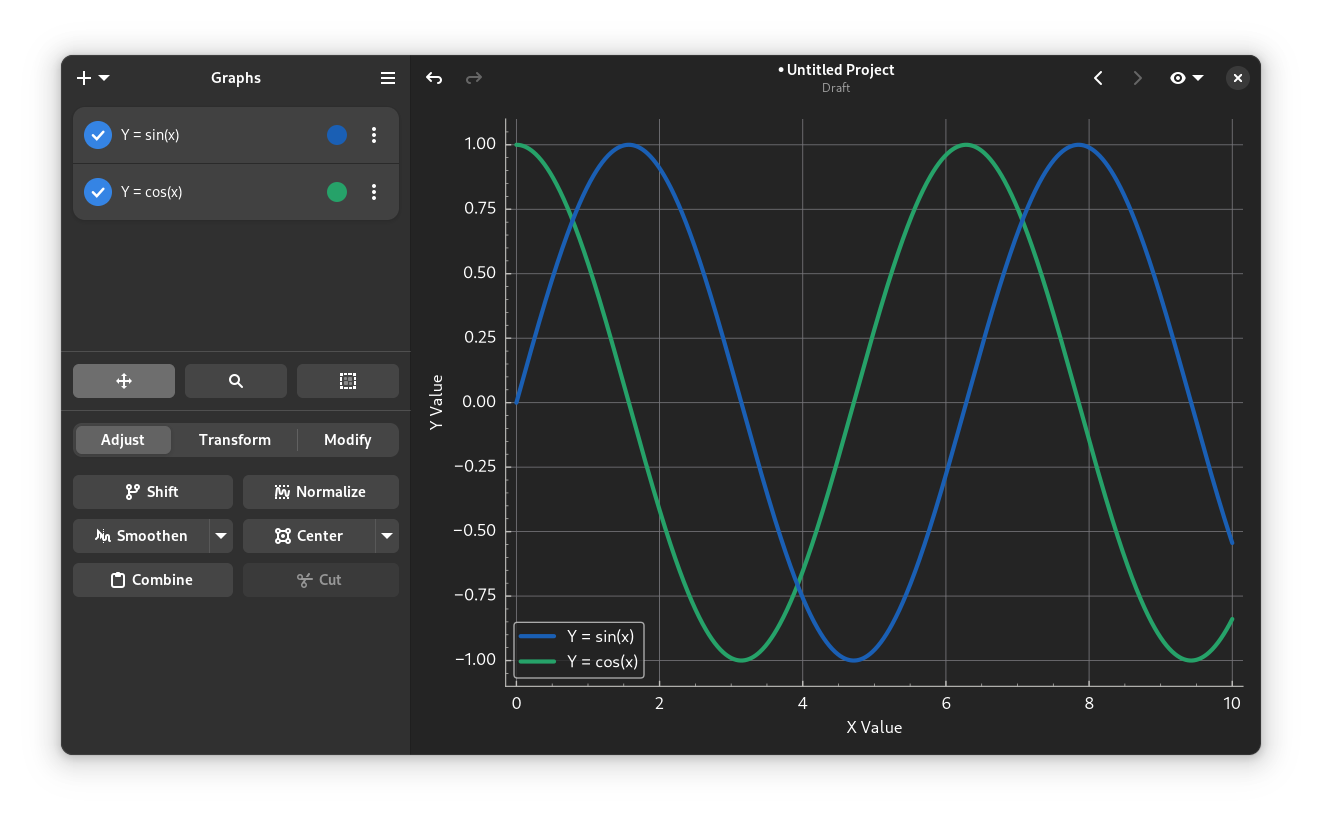
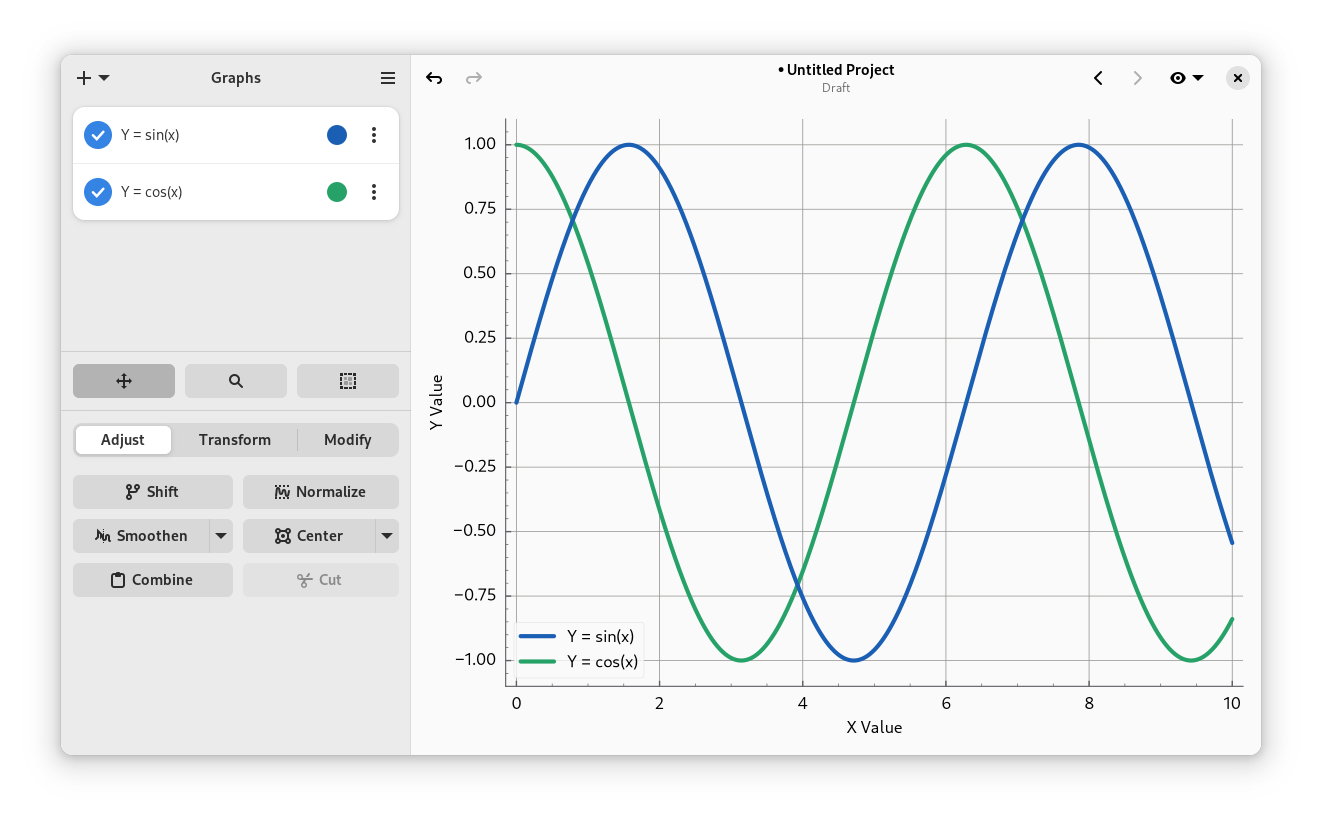
Raw, unorganized data is incredibly difficult to interpret, let alone present to a team or publish in a scientific paper. Translating complex coordinates, equations, and experimental results into a clear, visually compelling layout is a constant hurdle for researchers, students, and engineers. The Graphs data plotting and manipulation tool solves this issue by offering a streamlined, powerful desktop environment to visualize and refine your datasets with absolute precision.
What is the Graphs Data Plotting and Manipulation Tool?
Developed by The Graphs Developers, Graphs is a dedicated Linux application built specifically to plot and manipulate data. Unlike overcomplicated spreadsheet software or rigid command-line plotting utilities, this application strikes a perfect balance between simplicity and deep customization. It integrates seamlessly into the GNOME desktop environment, though it functions flawlessly across other Linux setups as well, making it a highly accessible choice for the broader open-source community.
Core Features and Data Capabilities
This software handles the entire pipeline of data presentation, from initial ingestion to final artistic polish. Here are the standout capabilities that make it a reliable choice for technical professionals:
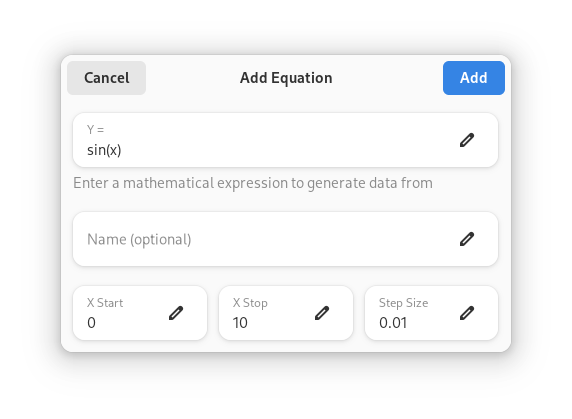
- Versatile Data Importation: You can bring your datasets into the workspace using a wide array of file formats, or generate completely new curves directly from mathematical equations.
- Advanced Manipulation Options: Clean and modify your datasets on the fly. The application supports essential operations such as selecting, cutting, translating, multiplying, centering, and smoothing your curves. You can also apply entirely custom transformations.
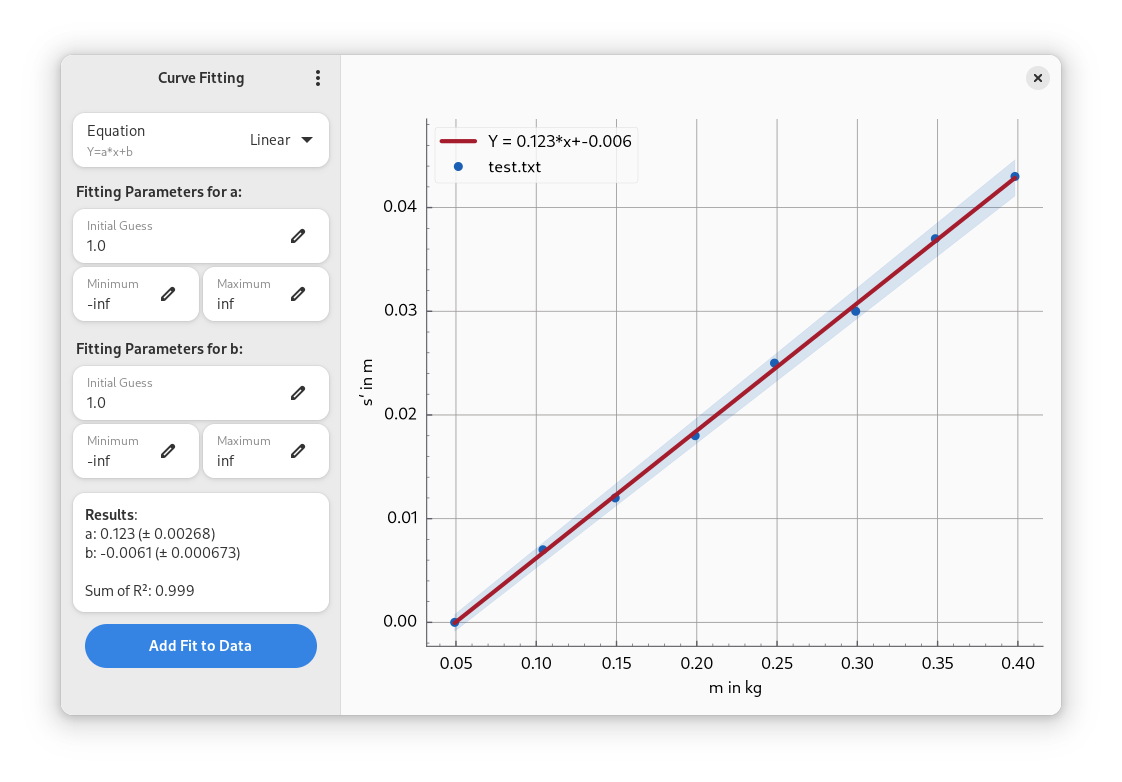
- Curve Fitting: Analyze trends and model your experimental findings with built-in curve-fitting tools designed for analytical accuracy.
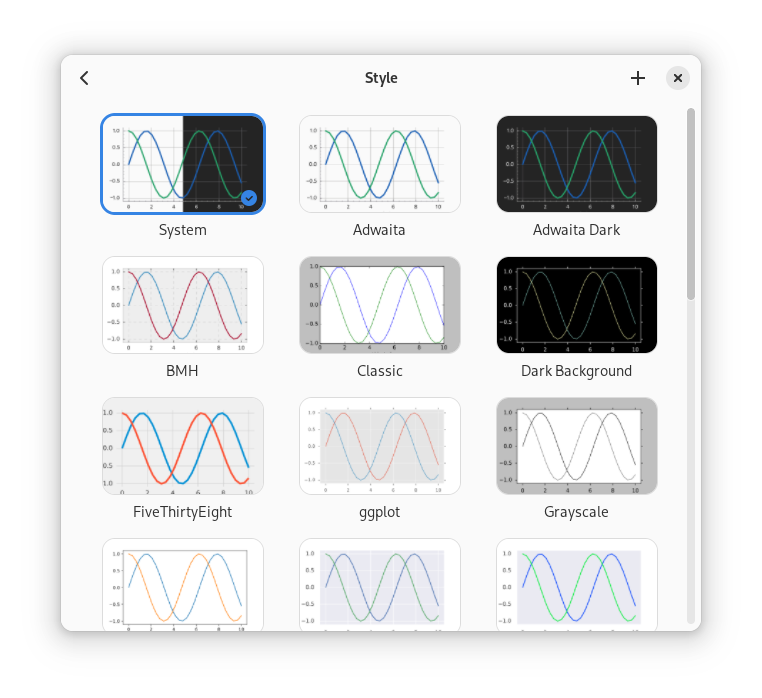
- Deep Presentation Customization: Tailor your visual style by adjusting stylesheets to your exact preferences. Ensure your colors, line weights, and labels match your corporate or academic guidelines.
Built for Academic and Professional Sharing
Once you have used the Graphs data plotting and manipulation tool to refine your visualizations, sharing your results is remarkably straightforward. The application allows you to export your finished plots into multiple formats optimized for presentations or academic publications. For those who require absolute precision, exporting your plots as vector graphics allows for seamless, lossless editing in external vector design tools like Inkscape. If you encounter any issues or want to request a feature, you can easily connect with the community via their official GitLab repository.
How to Get Started
If you are looking for a dedicated Linux tool to elevate how you visualize scientific data, this utility is an excellent fit. To explore its capabilities and install it on your system, head over to the official Flathub store page to download the flatpak version and begin streamlining your data workflow today.
Rate the App
User Reviews













Popular Apps









Editor's Choice